In 2006, Chris Anderson, the editor-in-chief of Wired magazine, wrote a bestselling book about an idea he called the long tail. The long tail is nicely illustrated by the bookselling business. Until recently, the conventional wisdom in bookselling was to stock only bestsellers. But internet bookstores such as Amazon.com take a different approach, stocking everything in print. According to Anderson, about a quarter of Amazon’s sales come from the long tail of books outside the top 100,000 bestselling titles (see here for the original research). While books in the long tail don’t individually sell many copies, they greatly outnumber the bestsellers, and so what they lack in individual sales they make up in total sales volume.
The long tail attracted attention because it suggested a new business model, selling into the long tail. Companies like Amazon, Netflix, and Lulu have built businesses doing just that. It also attracted attention because it suggested that online collaborations like Wikipedia and Linux might be benefitting greatly from the long tail of people who contribute just a little.
The problem if you’re building a business or online collaboration is that it can be difficult to tell whether participation is dominated by the long tail or not. Take a look at these two graphs:
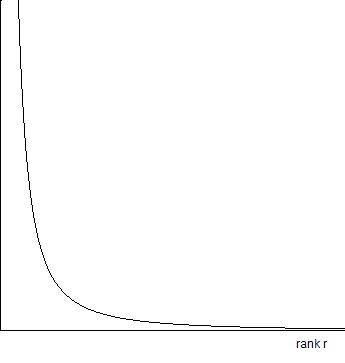

The first graph is an idealized graph of Amazon’s book sales versus the sales rank, [tex]r[/tex], of the book. The second graph is an idealized graph of the number of edits made by the [tex]r[/tex]th most prolific contributor to Wikipedia. Superficially, the two graphs look similar, and it’s tempting to conclude that both graphs have a long tail. In fact, the two have radically different behaviour. In this post I’ll describe a general-purpose test that shows that Amazon.com makes it (just!) into the long tail regime, but in Wikipedia contributions from the short head dominate. Furthermore, this difference isn’t just an accident, but is a result of design decisions governing how people find information and make contributions.
Let’s get into more detail about the specifics of the Amazon and Wikipedia cases, before turning to the big picture. The first graph above shows the function
[tex]a / r^{0.871},[/tex]
where [tex]a[/tex] is a constant of proportionality, and [tex]r[/tex] is the rank of the book. The exponent is chosen to be [tex]0.871[/tex] because as of 2003 that makes the function a pretty close approximation to the number of books sold by Amazon. For our analysis, it doesn’t much matter what the value of [tex]a[/tex] is, so we won’t worry about pinning it down. All the important stuff is contained in the [tex]r^{0.871}[/tex] in the denominator.
The second graph shows the function
[tex]a / r^{1.7}.[/tex]
As with the Amazon sales formula, the Wikipedia edit formula isn’t exact, but rather is an approximation. I extracted the formula from a blog post written by a researcher studying Wikipedia at the Xerox PARC Augmented Cognition Center. I mention this because they don’t actually determine the exponent 1.7 themselves – I backed it out from one of their graphs. Note that, as for the Amazon formula, [tex]a[/tex] is a constant of proportionality whose exact value doesn’t matter. There’s no reason the values of the Wikipedia [tex]a[/tex] and the Amazon [tex]a[/tex] should be the same; I’m using the same letter in both formulas simply to avoid a profusion of different letters.
(A little parenthetical warning: figuring out power law exponents is a surprisingly subtle problem. It’s possible that my estimate of the exponent in the last paragraph may be off. See, e.g., this paper for a discussion of some of the subtleties, and references to the literature. If someone with access to the raw data wants to do a proper analysis, I’d be interested to know the results. In any case, we’ll see that the correct value for the exponent would need to be wildly different from my estimate before it could make any difference to the qualitative conclusions we’ll reach.)
Now suppose the total number of different books Amazon stocks in their bookstore is [tex]N[/tex]. We’ll show a bit later that the total number of books sold is given approximately by:
[tex]7.75 \times a \times N^{0.129}.[/tex]
The important point in this formula is that as [tex]N[/tex] increases the total number of books sold grows fairly rapidly. Double [tex]N[/tex] and you get a nearly ten percent increase in total sales. There’s a big benefit to being in the business of the long tail of books.
Let’s move to the second graph, the number of Wikipedia edits. If the total number of editors is [tex]N[/tex], then we’ll show below that the total number of edits made is approximately
[tex]2.05 \times a – O\left( \frac{a}{N^{1.7}} \right).[/tex]
The important point here is that, in contrast to the Amazon example, as [tex]N[/tex] increases it makes little difference to the total number of edits made. In Wikipedia, the total number of edits is dominated by the short head of editors who contribute a great deal.
A general rule to decide whether the long tail or the short head dominates
Let’s generalize the above discussion. We’ll find a simple general rule that can be used to determine whether the long tail or the short head dominates. Suppose the pattern of participation is governed by a power law distribution, with the general form
[tex]\frac{a}{r^b},[/tex]
where [tex]a[/tex] and [tex]b[/tex] are both constants. Both the Amazon and Wikipedia data can be described in this way, and it turns out that many other phenomena are described similarly – if you want to dig into this, I recommend the review papers on power laws by Mark Newman and Michael Mitzenmacher.
Let’s also suppose the total number of “participants” is [tex]N[/tex], where I use the term participants loosely – it might mean the total number of books on sale, the total number of contributors to Wikipedia, or whatever is appropriate to the situation. Our interest will be in summing the contributions of all participants.
When [tex]b < 1[/tex], the sum over all values of [tex]r[/tex] is approximately [tex]\frac{a N^{1-b}}{1-b}.[/tex] Thus, this case is tail-dominated, with the sum continuing to grow reasonably rapidly as [tex]N[/tex] grows. As we saw earlier, this is the case for Amazon's book sales, so Amazon really is a case where the long tail is in operation. When [tex]b = 1[/tex], the total over all values of [tex]r[/tex] is approximately [tex]a \log N.[/tex] This also grows as [tex]N[/tex] grows, but extremely slowly. It's really an edge case between tail-dominated and head-dominated. Finally, when [tex]b > 1[/tex], the total over all values of [tex]r[/tex] is approximately
[tex]a\zeta(b)-O\left(\frac{a}{N^b}\right),[/tex]
where [tex]\zeta(b)[/tex] is just a constant (actually, the Riemann zeta function, evaluated at [tex]b[/tex]), and the size of the corrections is of order [tex]a/N^b[/tex]. It follows that for large [tex]N[/tex] this approaches a constant value, and increasing the value of [tex]N[/tex] has little effect, i.e., this case is head-dominated. So, for example, it means that the great majority of edits to Wikipedia really are made by a small handful of dedicated contributors.
There is a caveat to all this discussion, which is that in the real world power laws are usually just an approximation. For many real world cases, the power law breaks down at the end of the tail, and at the very head of the distribution. The practical implication is that the quantitative values predicted by the above formula may be somewhat off. In practice, though, I don’t think this caveat much matters. Provided the great bulk of the distribution is governed by a power law, this analysis gives insight into whether it’s dominated by the head or by the tail.
Implications
If you’re developing a long tail business or collaboration, you need to make sure the exponent [tex]b[/tex] in the power law is less than one. The smaller the exponent, the better off you’ll be.
How can you make the exponent as small as possible? In particular, how can you make sure it’s smaller than the magic value of one? To understand the answer to this question, we need to understand what actually determines the value of the exponent. There’s some nice simple mathematical models explaining how power laws emerge, and in particular how the power law exponent emerges. At some point in the future I’d like to come back and discuss those in detail, and what implications they have for site architecture. This post is already long enough, though, so let me make just make three simple comments.
First, focus on developing recommendation and search systems which spread attention out, rather than concentrating it in the short head of what’s already popular. This is difficult to do without sacrificing quality, but there’s some interesting academic work now being done on such recommendation systems – see, for example, some of the work described in this recent blog post by Daniel Lemire.
Second, in collaborative projects, ensure a low barrier to entry for newcomers. One problem Wikipedia faces is a small minority of established Wikipedians who are hostile to new editors. It’s not common, but it is there. This drives newcomers away, and so concentrates edits within the group of established editors, effectively increasing the exponent in the power law.
Third, the essence of these and other similar recommendations is that they are systematic efforts to spread attention and contribution out, not one-off efforts toward developing a long tail of sales or contributions. The problem with one-off efforts is that they do nothing to change the systematic architectural factors which actually determine the exponent in the power law, and it is that exponent which is the critical factor.
Further reading
I’m writing a book about “The Future of Science”; this post is part of a series where I try out ideas from the book in an open forum. A summary of many of the themes in the book is available in this essay. If you’d like to be notified when the book is available, please send a blank email to the.future.of.science@gmail.com with the subject “subscribe book”. I’ll email you to let you know in advance of publication. I will not use your email address for any other purpose! You can subscribe to my blog here.
Wikipedia is edited by the short head, but it is written by the long tail. At least that is what Aaron Swartz argues here: http://www.aaronsw.com/weblog/whowriteswikipedia
It would be really interesting to see this kind of analysis for a field like physics. Many a scientist (not of Noble quality) must have asked themselves: “Am I really making a contribution, or is all the relevant progress being made by a small group of which am not a part?” Citation data that confirms a long tail distribution would be very comforting to me.
I have a sugestion about this theme…
http://anand.typepad.com/datawocky/2008/07/the-real-long-tail-why-both-chris-anderson-and-anita-elberse-are-wrong.html
in the Blog datawocky, there is a post about the long tail theory and some comments about a study at Harvard Business Review on the subject. It is a really interesting and deep post.
Regards
Manoel
Thanks Erik and Manoel – Very interesting posts, both, and they’ll show up in my blog links. It’s a bit of pity neither is really quantitative, addressing the question of the size of the exponent in the power law, which I think is the critical issue. Schwartz’s post, though, does suggest that the value of the exponent for the distribution in total character volume of edits might be lower than the exponent for the number of edits. That would be very interesting, if true.
Wim – Nice question! No idea on the answer. Somebody like Sidney Redner might be able to answer it easily, though. Or even have already answered it in an earlier paper, perhaps.